Market Risk Infrastructure for Institutional Research
Systematic market regime, breadth, and risk signals — delivered nightly, versioned, and production-ready.
Designed by quants, for quants. Enterprise-grade delivery with schema versioning and rigorous data governance.
Why MRI Detects Stress Earlier
Many commonly used risk filters—like the 200-day moving average or VIX threshold triggers—rely on single-indicator logic that often lags market turns.
Two-Layer Architecture
MRI separates State (regime classification) from Severity (stress intensity), capturing both trend context and real-time stress independently.
Hysteresis Design
State transitions require confirmation to flip, reducing whipsaws during volatile periods while still responding to genuine regime shifts.
Shock Flags
Event-level flags capture acute market stress that may not yet register in trend-following indicators, enabling earlier defensive positioning.
Empirical Regime Analysis
Since Jan 2020, MRI flagged 19 of 21 stress events exceeding 4% drawdown.
"Flagged" = exited MOMENTUM_OK / NORMAL prior to drawdown, using only data available as of that date.
Market Flight Recorder — Crisis & Volatility Episodes
Point-in-time regime classification with event-level risk flags. No look-ahead bias.
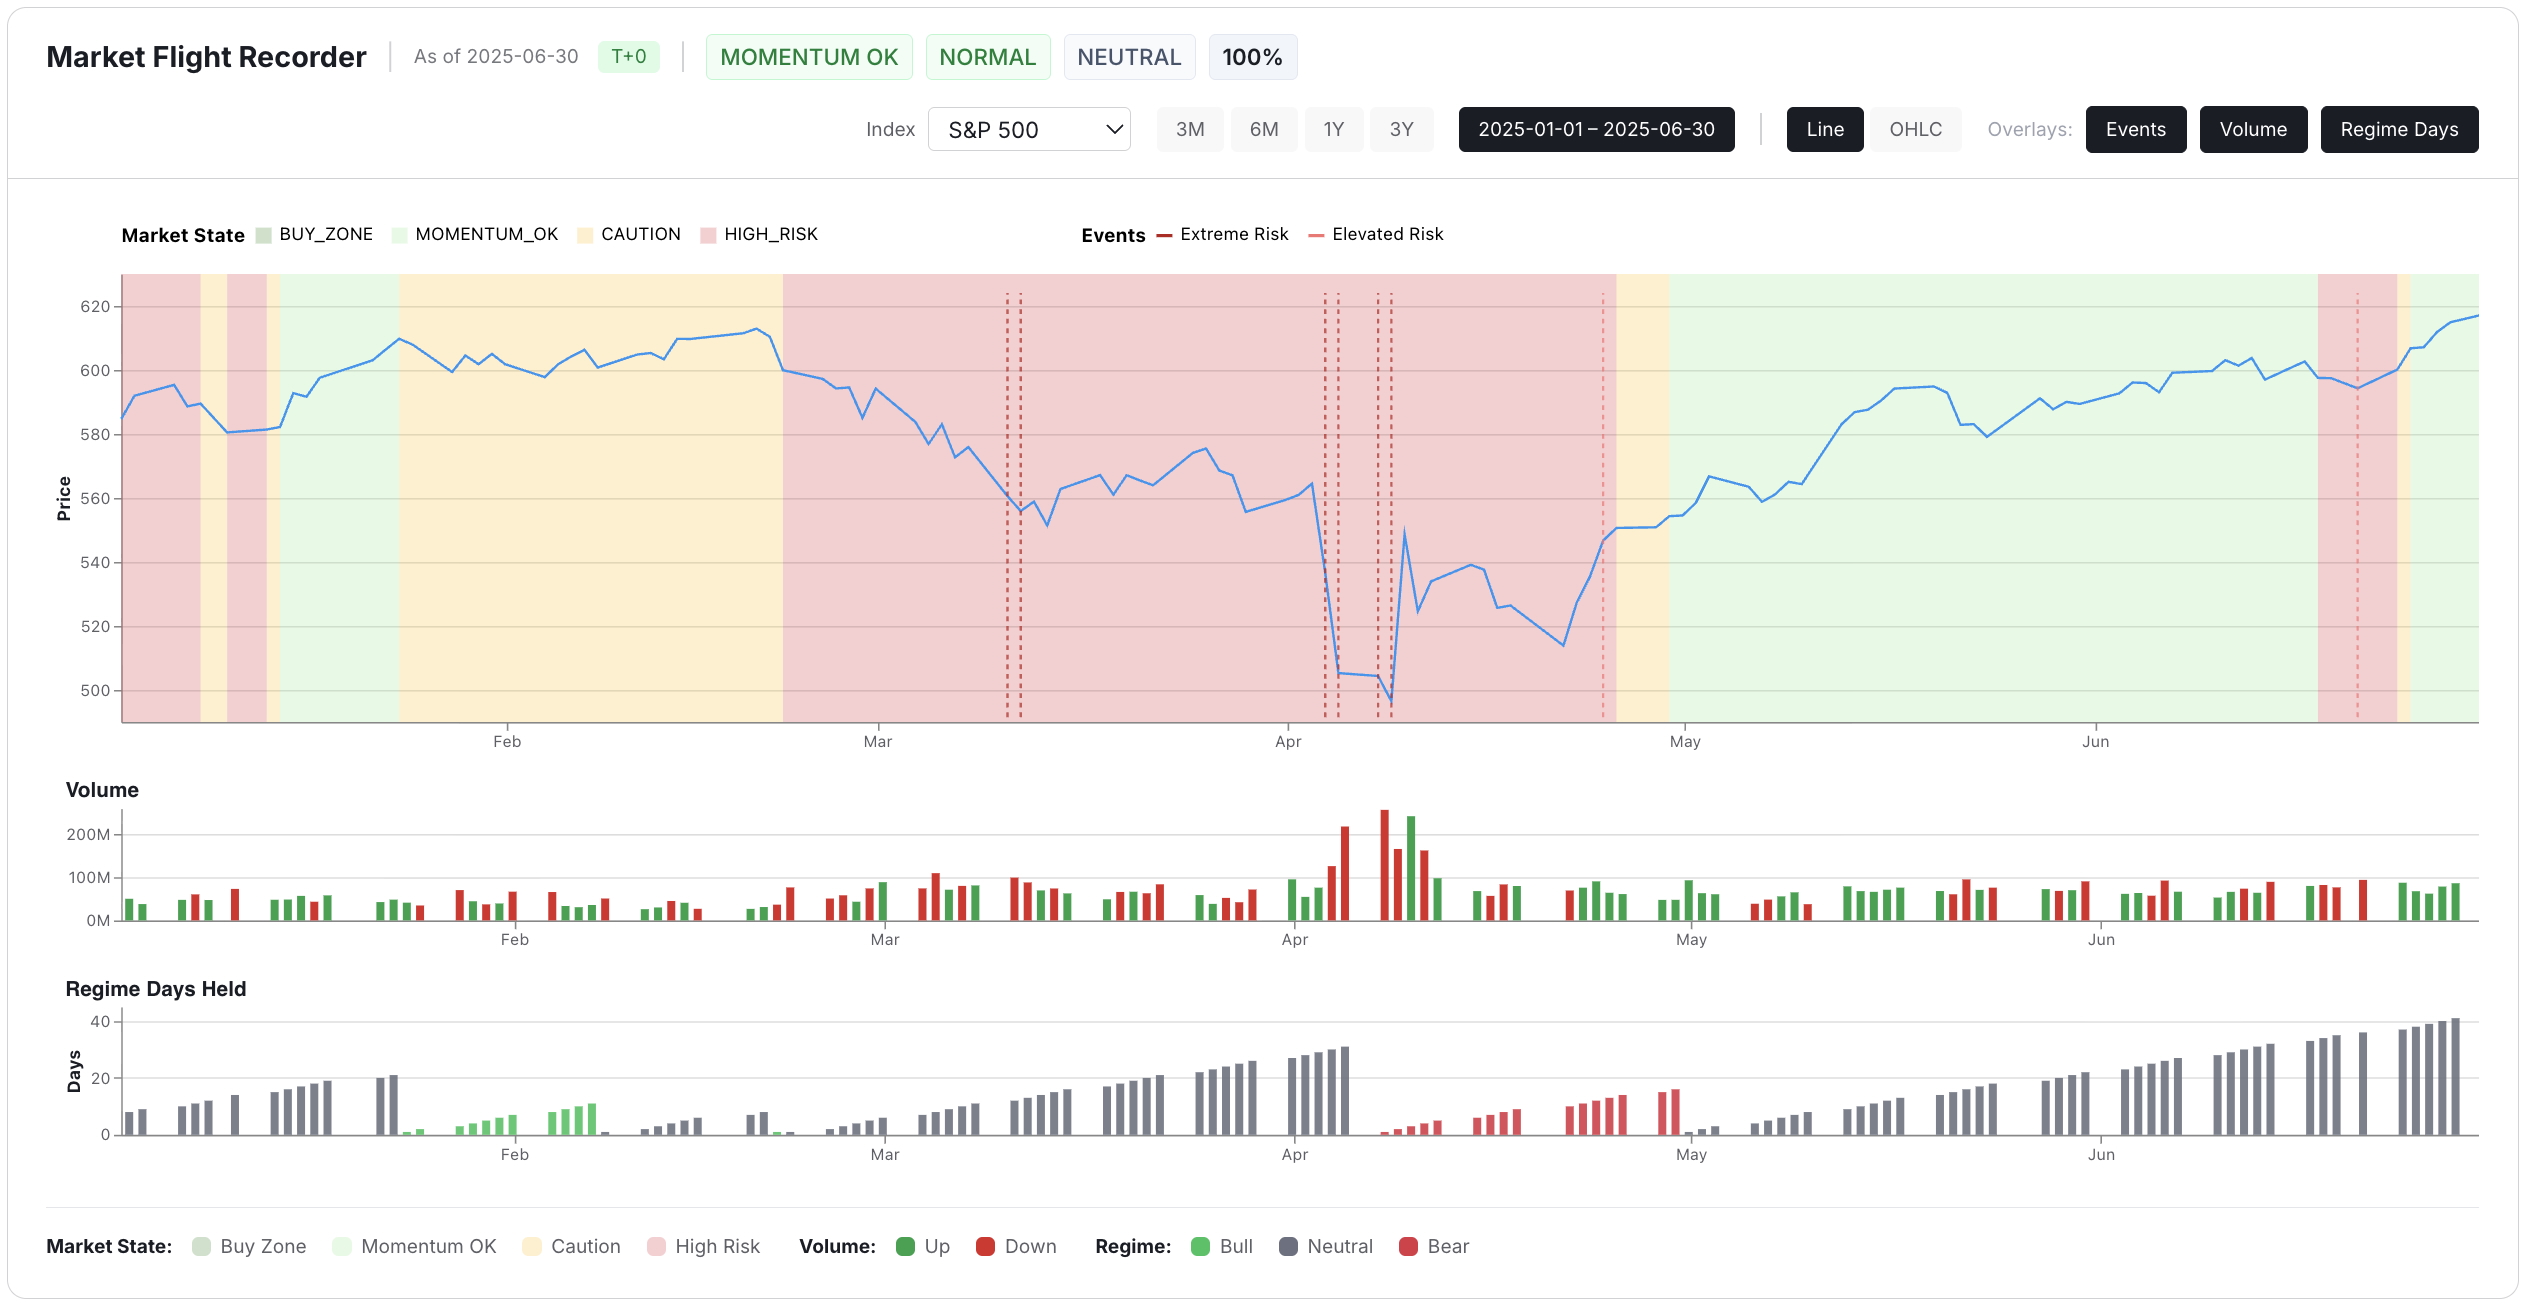
System flagged CAUTION / EXTREME on Feb 10, 2025. Index subsequently declined -13.9%.
Structural regime reflects longer-cycle conditions; tactical exposure is driven by short-term market state.
Windows selected to illustrate regime behavior under distinct stress types.
How Teams Use MRI
Exposure Conditioning
Scale gross/net exposure based on state × severity combinations
Regime-Conditional Backtests
Test factors across stress environments without look-ahead bias
Drawdown Control
Early warning for stops, hedges, and position sizing adjustments
Risk Committee Reporting
Auditable classification for investment committee oversight
Market Risk Infrastructure — 3-Minute Overview
A brief overview of AltQuant's Market Risk Infrastructure — a deterministic, regime-based risk layer designed for institutional quantitative workflows.
How You Access
AltQuant Access
Interactive UI Platform
- Interactive charts & visualizations
- Backtest views
- Real-time status monitoring
- Product Documentation
Snowflake Marketplace
Data Delivery
- Daily refresh
- 6+ years History
- Schema versioning
- Secure views sharing
Coming Soon: AWS Data Exchange, Parquet
Ready to Get Started?
Connect with our team to discuss your data needs and explore evaluation options.
Allowlist access available on request.